.png?width=100&height=100&name=carto%20icone%20(1).png)

.png?width=100&height=100&name=carto%20icone%20(2).png)
.png?width=100&height=100&name=carto%20icone%20(3).png)
CARTO se connecte à votre Data Warehouse
BigQuery, Snowflake, Redshift, Databricks, et bien d'autres plateformes Data, pour faciliter l'import depuis une source de données unique et sécurisée et faire gagner en vitesse et agilité, même à grande échelle.
.png?width=500&height=281&name=Untitled%20design%20(17).png)
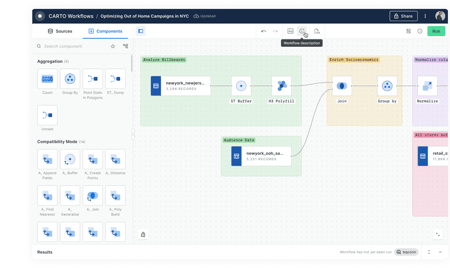
Une interface intuitive pour monter les pipelines
Conception et automatisation des pipelines de traitement et d'analyse de données grâce à une interface intuitive en "Drag and drop" et des templates de workflow préconfigurés.
Visualisation de données avancées
Visualisation de données riches et dynamiques exécutée sur votre Data Warehouse pouvant se lancer sur des données massives. Création de cartes interactives et de tableaux de bord adaptés à chaque usage.

Développement d'applications spatiales
Développer des applications spatiales puissantes via les APIs et boîte à outils mise à disposition. Des applications cartographiques évolutives, exécutées sur votre architecture Data sur Cloud.

 Supply Chain Optimization
Planning the most efficient delivery routes. Managing inventory and freight flows in real time. Tracking production and distribution of products worldwide.
How to ?
- By considering the spatial components of supply chain networks and gaining better visibility of your assets, more compact routes can be created for an entire fleet to reduce fuel and maintenance costs, using new data streams such as road traffic and weather conditions.
- Unlike traditional sales reps, users expect immediate response and accurate ETA as part of the customer experience. CARTO is able to quickly analyze and enrich spatial data to help in decision making and reducing delivery delays.
- Using spatial models, you can simulate demand by enriching the CARTO platform with event- or weather-related data streams to predict and forecast future demand scenarios.
 Site selection
Choosing optimal locations for new store, office, etc. Finding the best sites for warehouses, distribution centers, etc. Identifying high-potential areas for real estate development. Determining the most suitable sites for factories, production facilities, etc.
How to ?
- Using sophisticated analytical models to predict where the next big opportunity lies for your operations taking into account recent consumer behavior. External data streams to predict revenue on new or existing sites (pedestrian traffic, credit card transactions and weather conditions). Share information on store forecast performance in an intuitive solution.
- Identifying next big opportunities by viewing catchment areas and commercial areas to understand where your main customer segments are relative to your store network and competitor locations. Identify key target locations for expansion, in existing or new territories using our global spatial data catalog to help you make decisions.
- Identifying opportunities missed by competitors through consumer behaviour. The CARTO repository of more than 12,000 datasets keeps the pulse - from points of interest, social media sentiment, traffic data to demographics. Visualization of assets against competitors to identify new trends and opportunities ahead of others.
 Geomarketing
Targeting potential customers based on their location and characteristics. Developing personalized sales strategies for each geographic area. Designing more effective communication campaigns by considering audience location.
How to ?
- Mobile advertising campaigns analysis and visualization to understand how impression localization affects CTR, generated leads and CPA become a key part of the data strategy of modern marketers.
- Developing geofencing strategies with attendance, demographic and socio-economic data ensures a better return on campaign investment.
- Using new geospatial data streams to micro-segment customers and hypertarget campaigns based on location can have a significant impact on sales. Financial data, human mobility, geosocial or meteorological, the exact identification of targets makes marketing strategies more effective, spreading the right message to the right audience, at the right time and in the right place.
 Catastrophe modeling
Evaluating risks and potential impacts of natural disasters. Planning and managing disaster response. Coordinating relief and assistance to affected populations.
How to ?
- Enhancing CAT model results visualization using CARTO's Cloud-based Analytics Toolbox. Share your analysis quickly through a unique URL, automating the process from data ingestion to publication with our code-free visual tools.
- Less time cleaning, more time analyzing with spatial data repository. Avoid time loss in data discovery and evaluation. Enhance your insurance models with more spatial context for more accurate loss results.
- Access new spatial data quickly through Data Observatory to enhance your analyses. Opt for continuous data streams to better adapt your models to environmental changes.
 Data Monetization
Creating new B2B revenue stream. Providing increased value to partners and stackholders. Allowing anonymized and aggregated data to serve as spatial insights in developing location-based services & applications, and in creating machine learning models for decision making.
How to ?
- Transforming an industry-focused data into relevant spatial information for others various sectors.
- Allowing anonymized and aggregated data to serve as spatial insights in developing location-based services & applications, and in creating machine learning models for decision making.
Environmental Management
Monitoring and analyzing environmental changes. Combating pollution and deforestation. Protecting natural resources and ecosystems.
How to ?
- Track air pollutant emissions, identifying affected areas, locate sources, and predicting changes over time. Data that informs policies on traffic, manufacturing, and logistics.
- Real-time monitoring of forest fires through Data Observatory provides crucial information on fire perimeters and smoke density levels. This enables a prompt response from emergency agencies, governments, and other organizations.
- Anticipating climate risks with decision-making support system for a better population protection, regarding natural disaster and environmental changes.


